Core benchmark · same-context only
HepG2 repeated-fold model audit
This route contains only the frozen same-HepG2 benchmark. External-transfer and future-challenge readiness have separate denominators and routes.
Four benchmark questions
What does the safe model actually support?
Yes · repeated RMSE support
Favourable-direction effect 0.006292 (95% CI 0.005240 to 0.007352). Positive means lower model RMSE than the baseline.
Yes · modestly
Favourable-direction effect 0.000466 (95% CI 0.000225 to 0.000702). Positive means lower model RMSE; this is a small same-dataset improvement.
No · mixed
0.001224 (95% CI -0.000216 to 0.002498). The interval crosses zero; raw-direction recovery is not supported.
Reproducible within HepG2
0.045281 (95% CI 0.029650 to 0.061178). Positive within this dataset; it does not establish disease-context validity.
Visual benchmark interpretation
Five panels for the four benchmark questions
The figure below translates the frozen benchmark objects into a journal-style summary: RMSE support, raw-direction uncertainty, strict-versus-legacy gate behaviour, absolute error scale and target-level direction counts.
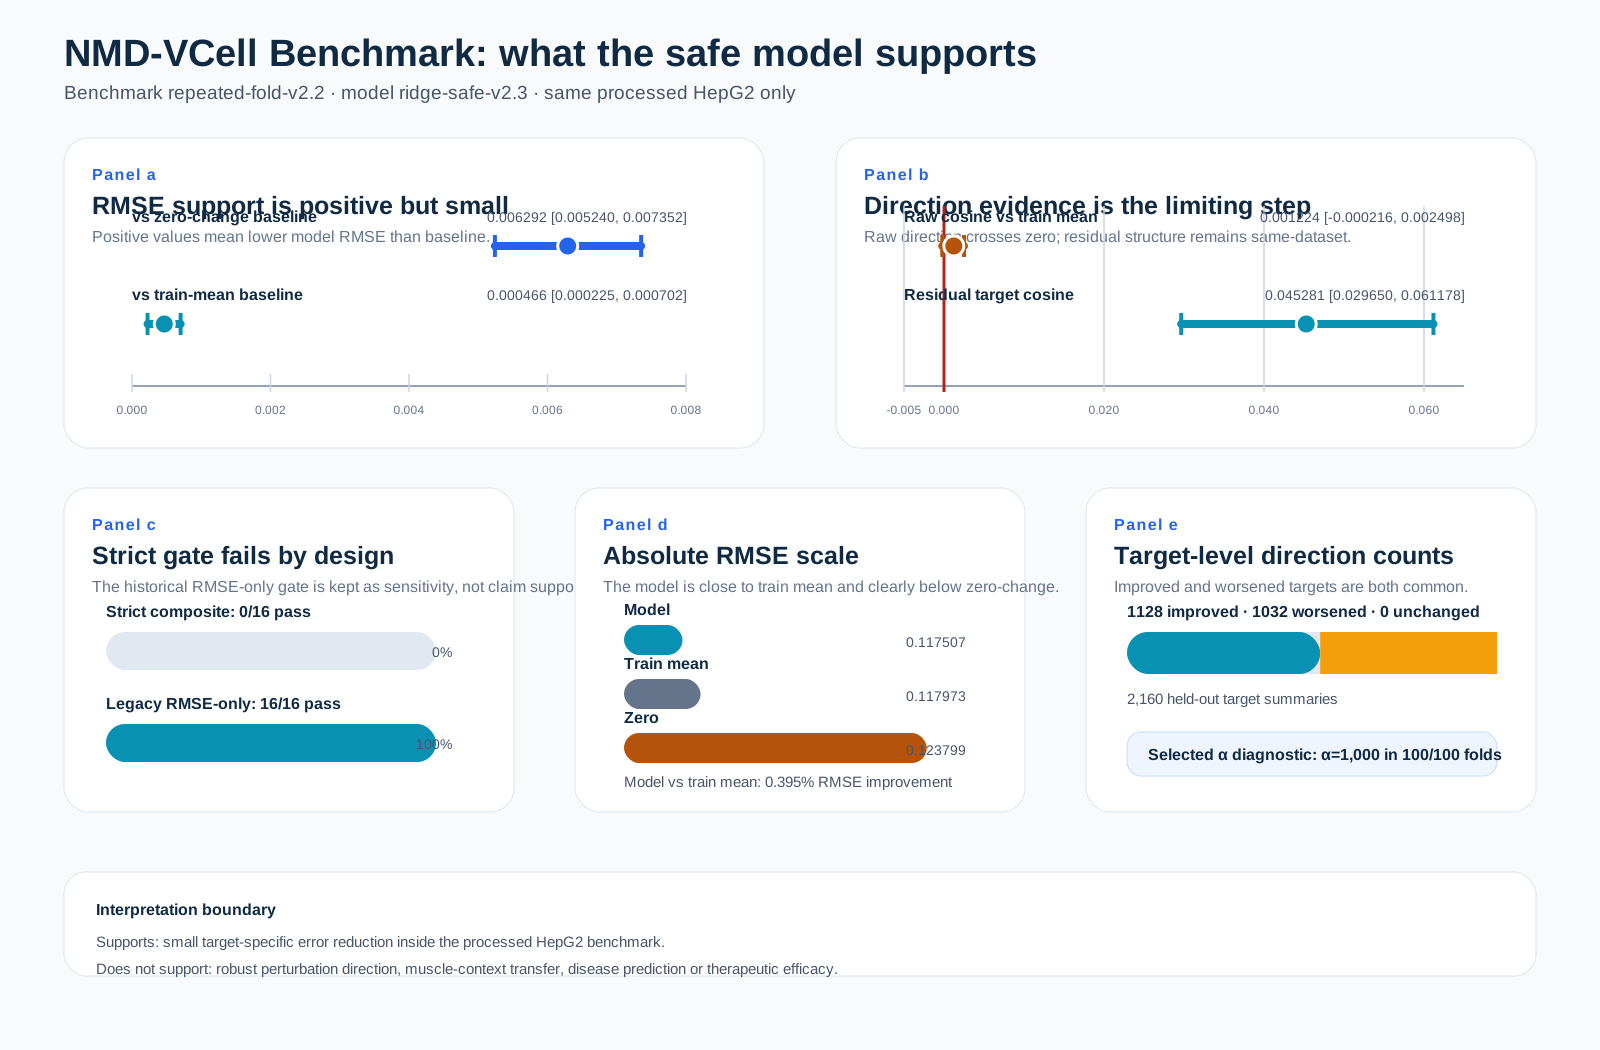
α=1,000 in 100/100 folds
The current frozen selected-alpha object records no finite-grid upper-boundary selection. The interpretation remains strong shrinkage close to the outer-training response mean, not robust disease-context prediction.
0/16 strict · 16/16 legacy
The 16 outcomes are the frozen direct-head model/split/endpoint combinations. The strict composite requires paired RMSE support, multiplicity control and raw-direction support; the legacy rule accepted the broader RMSE comparator and is retained only as a historical sensitivity.
Absolute scale and target distribution
0.117507
Across the 20 frozen safe_external_v1 realizations.
0.117973
Relative improvement: 0.395%.
0.123799
Relative improvement: 5.082%.
1128 improved · 1032 worsened
Across 2,160 targets; 0 were exactly unchanged.
Audit all 16 frozen strict outcomes
| Outcome ID | Model | Split | Endpoint | Favourable-direction effect | 95% CI | Multiplicity-adjusted P | Strict gate |
|---|---|---|---|---|---|---|---|
STRICT-01 |
ridge_v1 | val | rmse gain vs zero | 0.005559 | -0.004011 to 0.015838 | Not available for validation split | FAIL |
STRICT-02 |
ridge_v1 | val | rmse gain vs train mean | 0.007689 | 0.000406 to 0.01488 | Not available for validation split | FAIL |
STRICT-03 |
ridge_v1 | test | rmse gain vs zero | 0.006045 | -0.00107 to 0.013744 | 0.641587 | FAIL |
STRICT-04 |
ridge_v1 | test | rmse gain vs train mean | 0.006371 | -0.001359 to 0.013912 | 0.641587 | FAIL |
STRICT-05 |
mlp_v1 | val | rmse gain vs zero | 0.00665 | -0.00271 to 0.016749 | Not available for validation split | FAIL |
STRICT-06 |
mlp_v1 | val | rmse gain vs train mean | 0.00878 | 0.000834 to 0.016048 | Not available for validation split | FAIL |
STRICT-07 |
mlp_v1 | test | rmse gain vs zero | 0.002712 | -0.004185 to 0.009659 | 1 | FAIL |
STRICT-08 |
mlp_v1 | test | rmse gain vs train mean | 0.003038 | -0.00432 to 0.00985 | 1 | FAIL |
STRICT-09 |
ridge_v2 | val | rmse gain vs zero | 0.002517 | -0.011617 to 0.014142 | Not available for validation split | FAIL |
STRICT-10 |
ridge_v2 | val | rmse gain vs train mean | 0.004647 | -0.004459 to 0.012929 | Not available for validation split | FAIL |
STRICT-11 |
ridge_v2 | test | rmse gain vs zero | 0.006808 | 0.000178 to 0.014113 | 0.48959 | FAIL |
STRICT-12 |
ridge_v2 | test | rmse gain vs train mean | 0.007134 | -0.000712 to 0.014433 | 0.48959 | FAIL |
STRICT-13 |
mlp_v2 | val | rmse gain vs zero | 0.00357 | -0.006906 to 0.013639 | Not available for validation split | FAIL |
STRICT-14 |
mlp_v2 | val | rmse gain vs train mean | 0.0057 | -0.001864 to 0.012786 | Not available for validation split | FAIL |
STRICT-15 |
mlp_v2 | test | rmse gain vs zero | 0.002641 | -0.00457 to 0.01017 | 1 | FAIL |
STRICT-16 |
mlp_v2 | test | rmse gain vs train mean | 0.002968 | -0.00416 to 0.009724 | 1 | FAIL |
Download the typed outcome records. Validation-split rows predate the frozen primary multiplicity family and therefore retain a null adjusted-P field rather than an invented value.
No formal noise ceiling is available
Descriptive split-half medians are 0.331 (cell split) and 0.333 (batch split); guide-pair median cosine is 0.006 across 133 auditable targets. These are reliability diagnostics, not an experimental ceiling. Independent biological replicates are still required before reporting a fraction of ceiling achieved.
Read the reliability boundaryBiological meaning: the model captures a small amount of target-specific error reduction within the processed HepG2 dataset. It does not mean: robust perturbation direction, muscle validation or therapeutic efficacy.